![]()
![]()
We are innovating continuously...
WHAT'S NEW IN TOURSOLVER?
Below are the latest updates to feature TourSolver, the mobile app and the API:
Version TourSolver Spring 21

Release date: 03/03/2021
Contents
- Scan the barcodes of your parcels
- Forecast weather conditions
- Notify your recipients of new information (premium)
- Interoperability Improvements
- Improvements to the optimization page
- Home Page Improvements
- Improvements to my activity page
- Customer page improvements (premium)
- Improvements to the fullfiment page
 Scan the barcodes of your parcels
As the person in charge of operations, you want all products, packages, pallets used or delivered to customers to be scanned in order to track them in real-time and thus prevent losses.
TourSolver now allows you to scan your products (or parcels) labeled with QRCode or barcodes, guaranteeing you flawless traceability of your supply chain.

Would you like to test and integrate this free feature? Follow the tutorial here
== Back to the table of contents ==
Forecast weather conditions
As a planner, I would like to know the weather conditions of the next few days, especially when they are terrible, to adapt travel speeds or lengthen response times.
We forecast the weather conditions for all your route plans for the next few days. It is also possible to consult the forecasts for planned routes. The forecast is based on the place and exact time of the visit.

Figure: forecast on a route and a stop of the route located in the afternoon.
It is possible to set up weather alerts in case of severe weather conditions. You will then be alerted when the optimization page is loaded. This information can allow planners to modulate the speed of travel and possibly the time of visit.
Figure: alert settings and display on the optimization page.
== Back to the table of contents ==
Notify your recipients of new information (premium)
Notify health instructions for delivery or intervention
As a transport manager, I would like to communicate prevention emails (COVID, a reminder of documents to be provided etc...) in order to ensure a high level of security during the visit.

Figure: Example of instructions related to securing delivery during the COVID 19 crisis
To set up such a message, it will be necessary to activate the instructions function of the tabs Visit time windows and Imminent arrival. You will then be able to load the image of your choice.
Figure: Loading a target image from the customer experience pages configuration page and then viewing the result via the preview function.
== Back to the table of contents ==
Digitize & automate the sending of a report to your recipients
As a planner, I would like the sending of tickets or end of intervention reports to the customer to be dematerialized and automated when the driver has finished his intervention.
This function can be activated via the email sending configuration. You will have to go to the End of visit tab and activate the function Insert the pdf report of the intervention as an attachment. The pdf will contain all the fields of the report of the mobile app that can be displayed on the customer experience pages.
When the deliveryman or technician has completed the visit from the mobile application, the end-of-visit email is sent to the recipient with the end-of-visit pdf report.
Figure: the end of the visit from the mobile app triggers the sending of the end-of-intervention email, the attachment of which is a pdf report of the intervention report.
== Back to the table of contents ==
Notify the number of remaining customers and the abandonment of the visit.
The number of clients remaining
Do you want to give visibility of the number of customers remaining before delivery?
This version allows you to do so. In the page configure the sending of e-mails / SMS you can now set the threshold (in the number of customers) triggering imminent arrival notification. When this setting is active, the ETA page will display the number of remaining visits.
Figure: setting in the SMS sending configuration page and then in the customer experience pages of the remaining customer number threshold, then viewing in the preview function.
== Back to the table of contents ==
Abandonment of visit
When the resource using the mobile app abandons an intervention, a message can also be sent to the client to notify about it.
Figure: Example of settings and email received by a customer when abandoning a visit.
== Back to the table of contents ==
 Interoperability Improvements
Single sign-on (SSO)
As a planner, I want to log in with the same login and passwords that I use every day on my professional computer.
In this version, it is now possible to connect with the same accesses as your company. This single sign-on feature increases your security and convenience. Less password fatigue, reduction of password entry time, reduction of support time in case of forgotten password etc...
Implementing this function requires a few days of service, if you are interested: contact us.
== Back to the table of contents ==
New connectors for importing the customer repository
In this version, we generalize the addition of Google and OneDrive import connectors by applying them to the client page.
Figure: successive import of the same dataset via google sheet and one drive.
== Back to the table of contents ==
New connectors & optimization export enhancements
Google calendar export
This version also offers new possibilities and improvements for exporting your routes. You can now export your routes via Google Calendar.
Kml export
It is also possible to export in .kml format.
Figure: export of the routes in .kml format then loading the file in Google Earth.
== Back to the table of contents ==
Outlook 365 export improvements
Finally, we have made improvements on Outlook export. It is possible to assign an Outlook schedule to a route and it is also possible to link a comment field of your visits so that it appears in the notepad of your outlook appointment.
Figure: export of a route to an outlook 365 calendar with a comment field from the import file and updated in TourSolver.
== Back to the table of contents ==
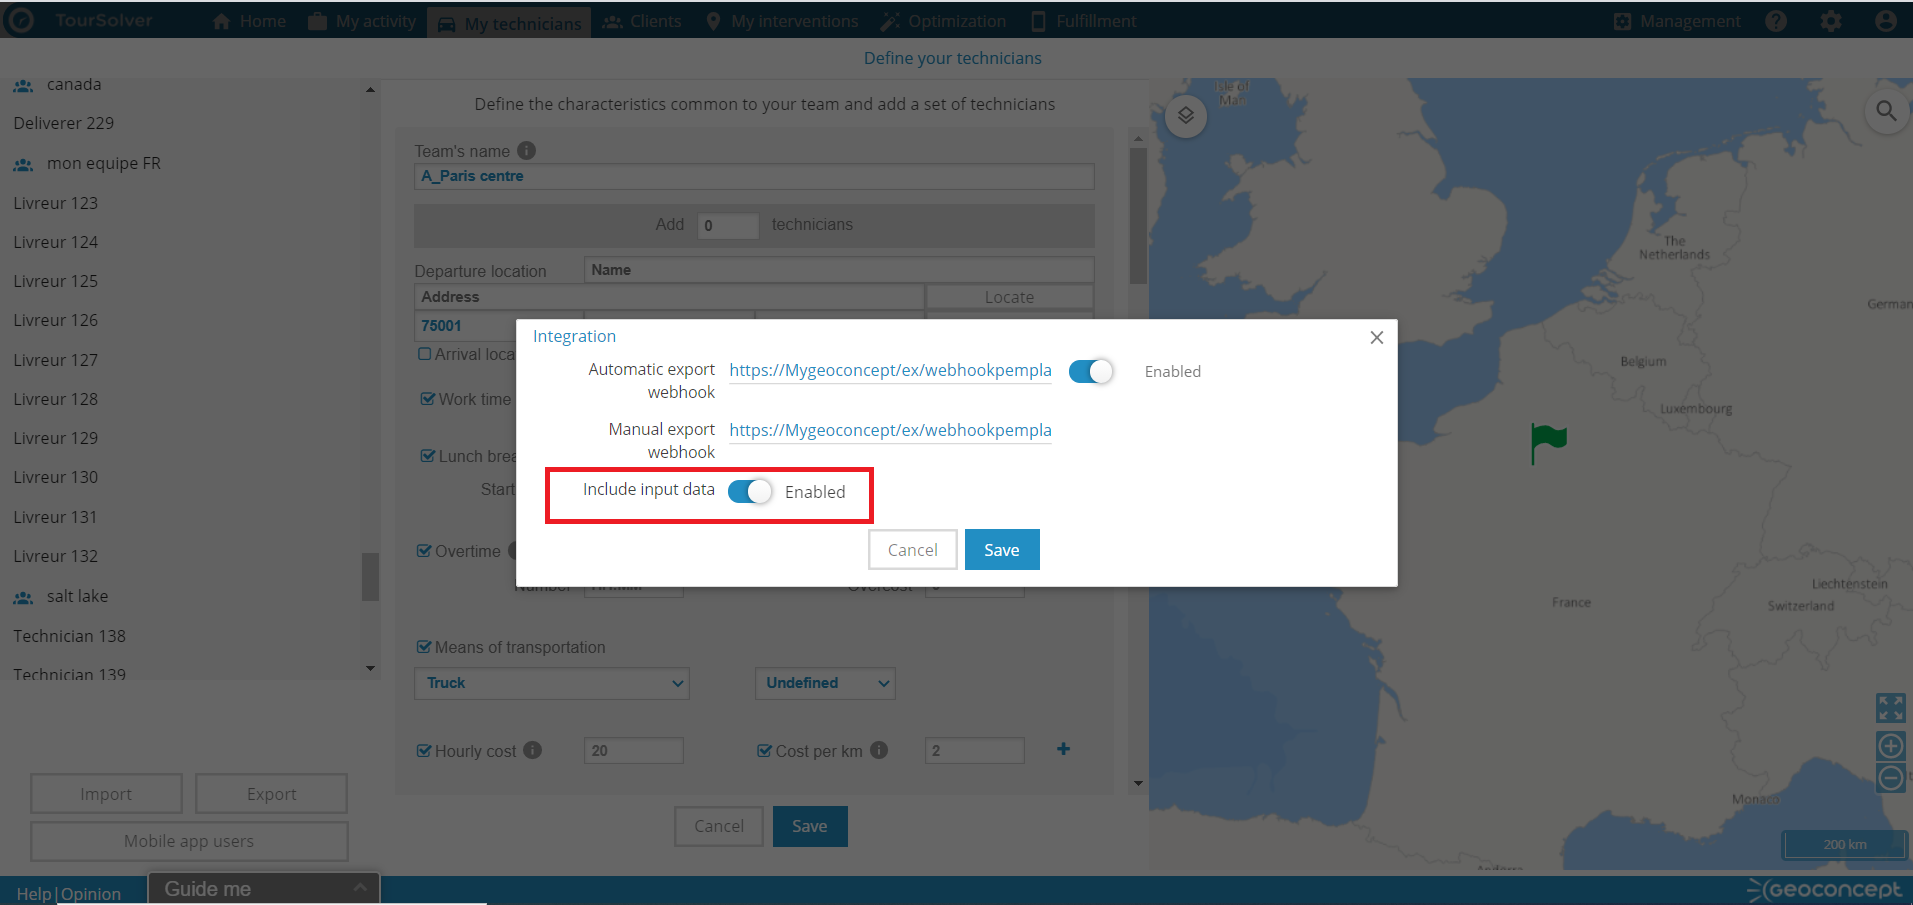
Webhook export improvements
The webhook export function now allows you to add the data you have imported. This will make it easier for you to link TourSolver results with internal identification fields for example.
Improvements on the optimization page
Analyze your optimization data
As a transport planner, I want to quickly identify and measure all my logistic constraints to adapt my route plans.
In this version we provide 7 graphs on your data in an Analysis view. The proposed graphs are clickable and interact with the map and the list. You will be able to locate more easily the visits that need your attention.
Figure: activation of the Analysis panel & visualization of 7 interactive graphs.
== Back to the table of contents ==
Improvements to overnight stays
As a transport manager I would like to identify hotels close to the end of the route to book a room.
By selecting two consecutive routes you can ask TourSolver to find hotels nearby. The application will guide you to the reservation.
Figure: the selection of 2 routes, then hotel search, and finally room reservation on a specialized site.
New! In this version, the overnight stays are managed with the new optimization engine.
== Back to the table of contents ==
Measuring the impact of your changes
As a planner, I would like to see the impact of my changes on the routes so that I can be helped in my decision making
After making changes, it is possible to see the impact in terms of KPIs by displaying the dashboard. This view will confirm or invalidate the assumption you have made. It will then always be possible to go back!
Figure: modification then visualization of the impact via the dashboard indicators.
== Back to the table of contents ==
Modify the attributes of your data in mass.
With this version, you will be able to modify the attributes of your data in mass. So you won't have to re-import your Excel file for example. To do this, you just have to select the visits to modify, go to the visit panel, click on action, modify visit and choose the attribute to modify.
Figure: Modification of the duration of 2 visits. Initially 10 minutes is extended to 50 minutes.
== Back to the table of contents ==
New cartographic features
In this version, we have added cartographic representation functionalities allowing to :
- See the map in black & white: easier to distinguish the routes in color!
- See geographical sectors: you have to import the sector field to see them.
- Cluster visits: useful when you have a lot of points to see on the map
Figure: visualization of the new cartographic functions from the layer manager.
== Back to the table of contents ==
New view of the routes
Before when you click on a route in the Gantt view or list of the route panel, the route is broken down into a Gantt view and a detailed list of stops, on the other hand, the map is zoomed to the target route.
This view provides access to the reassignment or de-planning function.
Figure: detailed view of a route with the functions "assigned customers" and "unassigned".
== Back to the table of contents ==
Home Page Improvements
More concise, the home page now contains only two buttons: Create a new simulation and the main action button See the list of simulations. The table is positioned in the center of the page and integrates 3 to 4 new columns :
- Creator only visible for premium licenses using the user management feature
- Distance
- Number of visits
- Drive duration
Finally, an arrow indicates the location of the interactive help.
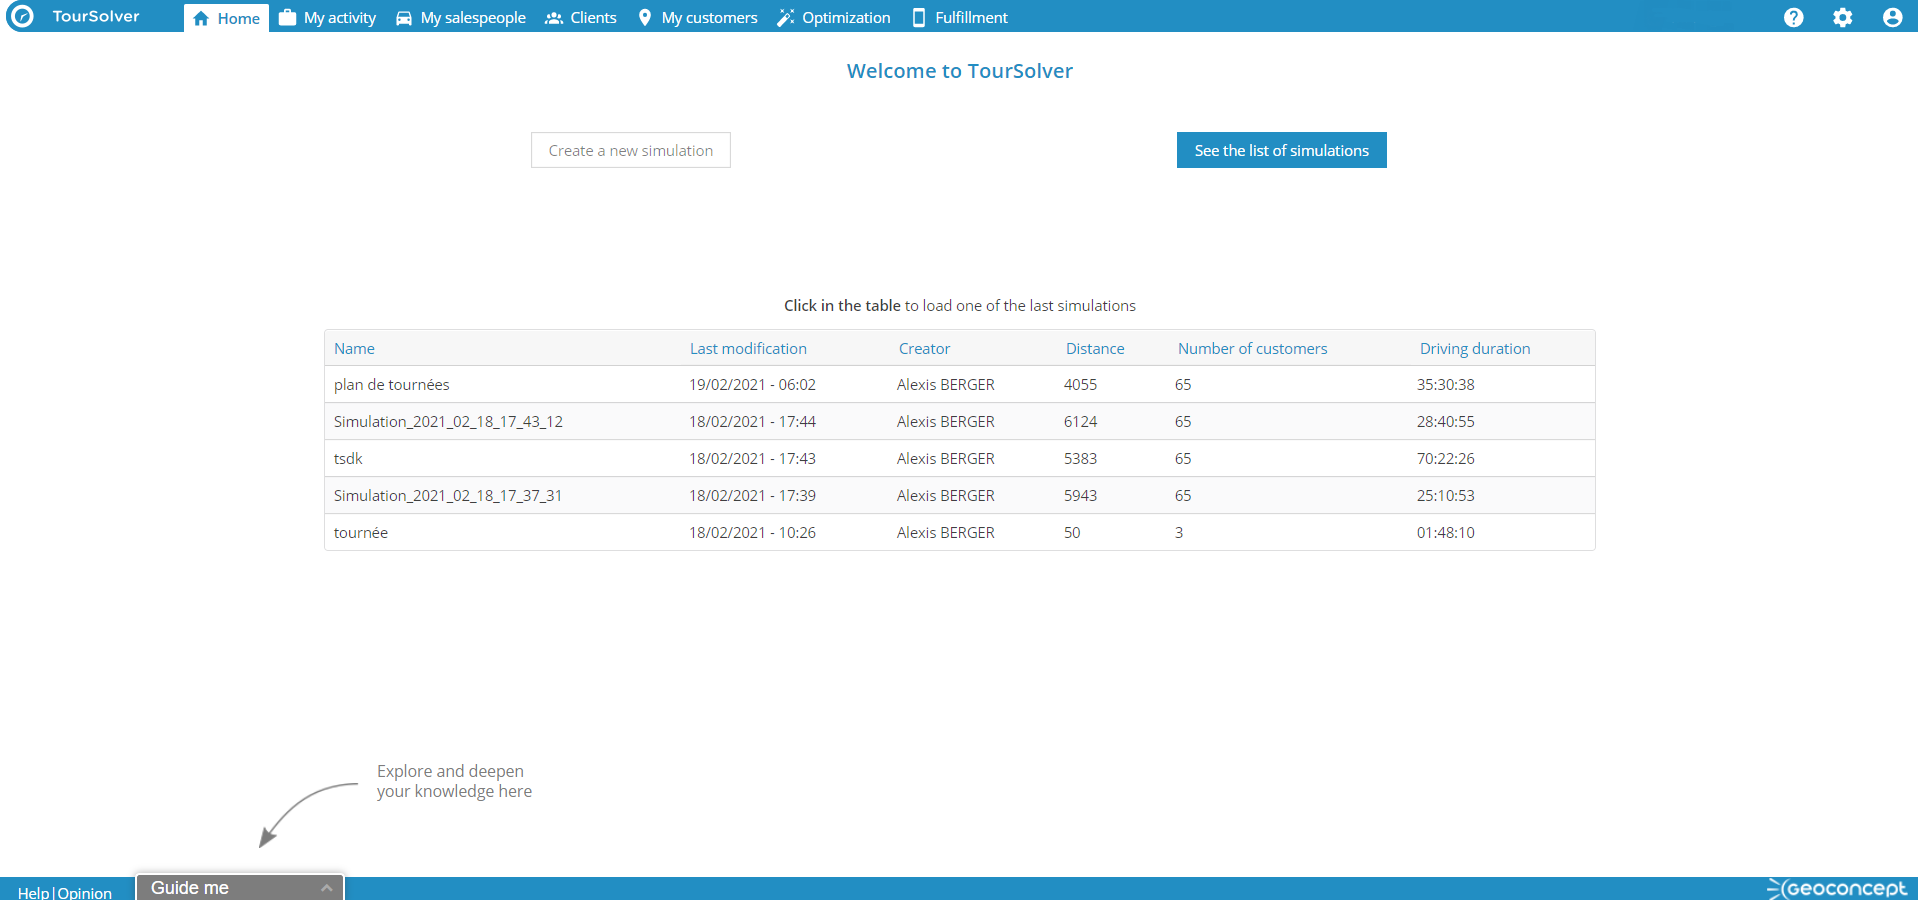
Figure: View of the home page with five recent simulations and a Creator column also.:
== Back to the table of contents ==
Improvements to my activity page
Vehicle profiles (premium)
We have added hazardous material attributes to your vehicle profiles.
On the other hand, we also added a parameter that allows adjusting the speed between an off-center dwelling place and the road (closing speed. In the field of press distribution for example this is a parameter that you could speed up to the maximum because usually the distribution stops at the letterbox near the street.
Figure: List of new managed hazardous materials constraints
== Back to the table of contents ==
User management (premium)
A new role
In this version, we have added a new role "see plannings of others" (or "SEEOTHERSPLANNINGS" for import). It prevents to see (on the fullfilment page) other schedules than your own.
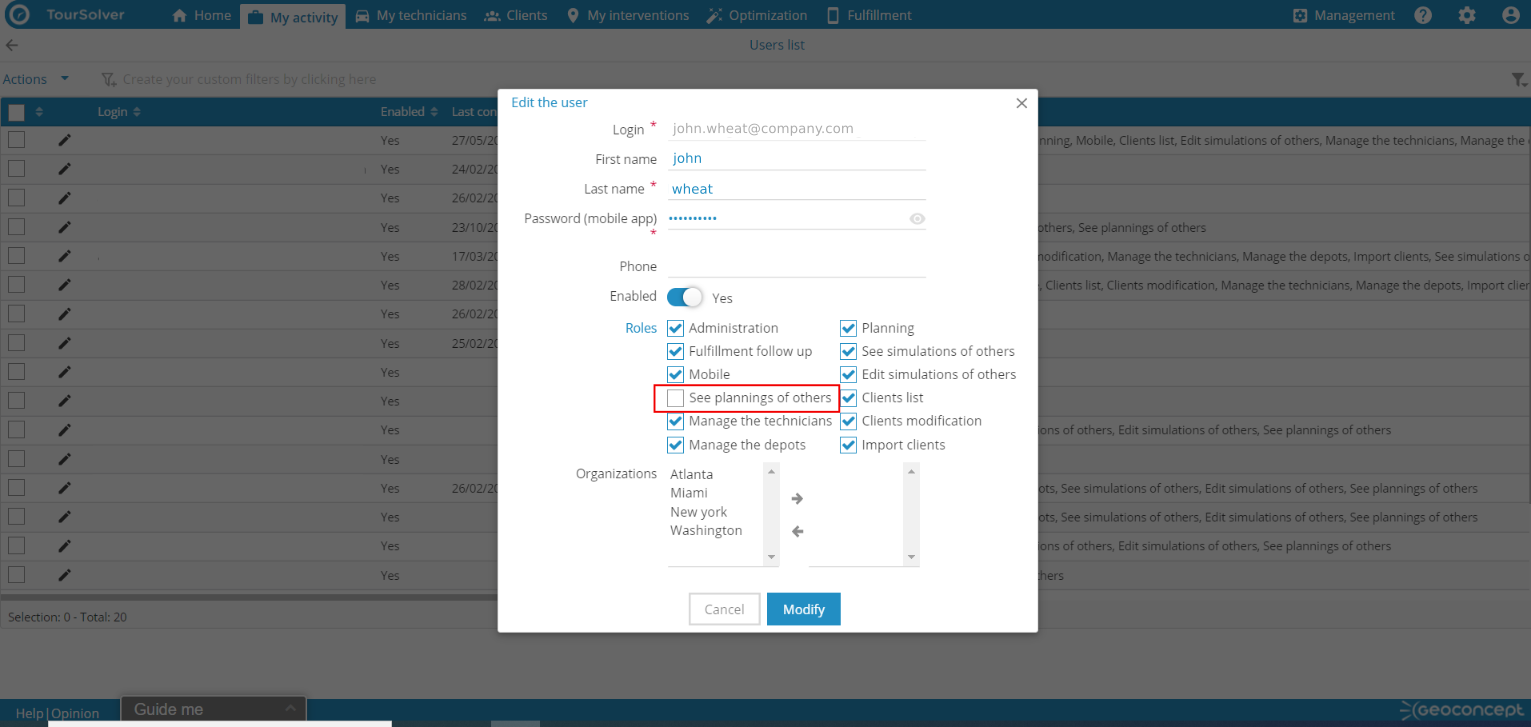
Figure: in this example the user can do everything but see the schedules of his colleagues (on the fullfilment page).
Export the list of users
In this version it is possible to export the list of users. The export file takes the current view. Therefore, if you want to have an export with all the columns, it is necessary to display all the columns in the current view.
Figure: in the example, the user adds all columns in the current view before exporting the list of users.
== Back to the table of contents ==
Customer page improvements (premium)
In this version, we have improved the localization of clients which can now be done manually. On the other hand, we have added two synchronization functions with the client database.
Customer modification from the optimization page
Addition of a new client created from the optimization page
Synchronization of mobile uploads to the customer page
In this version, it is possible to upload TourSolver mobile report entries in your customers' fields.
Synchronization of customer data with customer experience pages
You want to display the fields from the customer database in the "customer experience" notification pages? It is now possible via the general tab of the "customer experiences" pages.
== Back to the table of contents ==
Improvements to the fullfiment page
Management of abandoned visits.
When a customer is not present, and you are generally unable to access the delivery or service location, the mobile resource may then abandon the visit.

In this version, we have added the possibility to reschedule an abandoned intervention from the fullfilment page manually.
Figure: Manual rescheduling three days later of an abandoned visit.
== Back to the table of contents ==
An assessment of the distances traveled
You can activate the cumulative mileage of a route to compare it with the planned one.
Figure: activation and downloading of the excel report containing the real distance (GPS)
== Back to the table of contents ==
---------------