 Dashboard
Principles
The dashboards allow the user to manage his activity. They can be consulted by a manager to monitor customer satisfaction, by a planner to follow the evolution of the fulfillment, or by the administrator to follow the use of the product by his teams.
Use
Set up the different dashboards
Several dashboards, which group together distinct indicators, are made available to the user. Each dashboard is made up of tables that aggregate the global data, and charts that represent it by team, resource or mobile user.

The user selects the dashboard that contains the items of interest by clicking on the Dashboard drop-down menu. The user can choose between :
- Fulfillments
- Visits
- Tips
- Consumption
- Schedulers
- Evolution
- Mobile users
In the Team filter, the user can filter according to one or more teams whose indicators he wants to see. By default, all teams are selected.

The Aggregate/Don't Aggregate button allows you to define whether the data should be aggregated at the team level for simplified readability or left at the resource/mobile user level

An additional filter can then be set on the resource constraints to specify the exact resources/mobile users to display.

The notion of periodicity can be defined at the top right of the interface, in Time span filter. Several choices are possible: the last hour, the last 6 hours, the last 24 hours, the last 7 days, the last 14 days, the last month or personalized. In the case of a personalized period, the user defines a start date and time, as well as an end date and time of the desired period.

After modifying the dashboard parameters, the user must click on the Reload button, at the top right of the graphs, in order to update the data.
The icons at the top right of each graph allow you to define the type of graph: pie chart or histogram 
The export button at the top right  allows you to export the data represented in the dashboard for the desired period in Excel format (.xlsx).
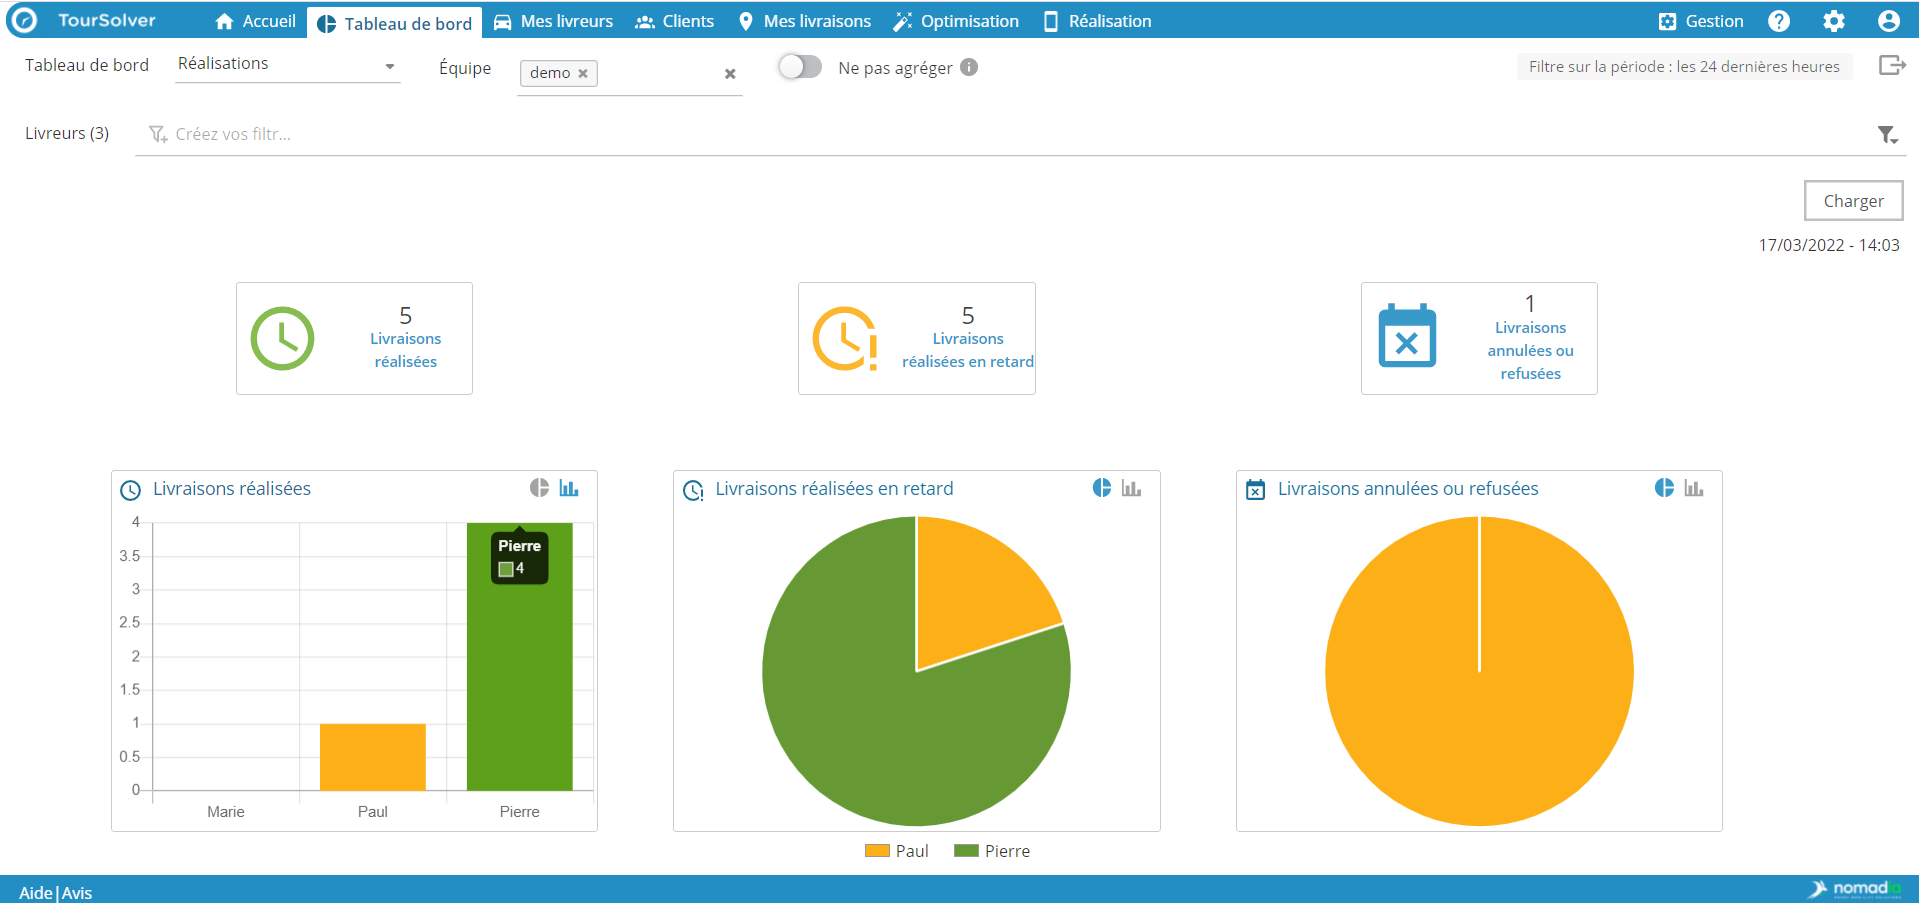
Fulfillment

Each indicator is represented globally and then at the team/resource level according to the specified filters, over a defined period.
Deliveries made: as visits are made, this data is incremented for real-time monitoring of activity. Late and on-time deliveries are counted. Cancelled and rescheduled deliveries are not counted.
Late deliveries: as late visits are made, this data is incremented to monitor activity and as an indicator of customer satisfaction. A visit is considered late if it ends after the specified time slot.
Cancelled or refused deliveries: this indicator is incremented to alert the planner to a delivery problem, which should be rescheduled.
Visits
Each indicator is represented globally and then at the team/resource level according to the specified filters, over a defined period.
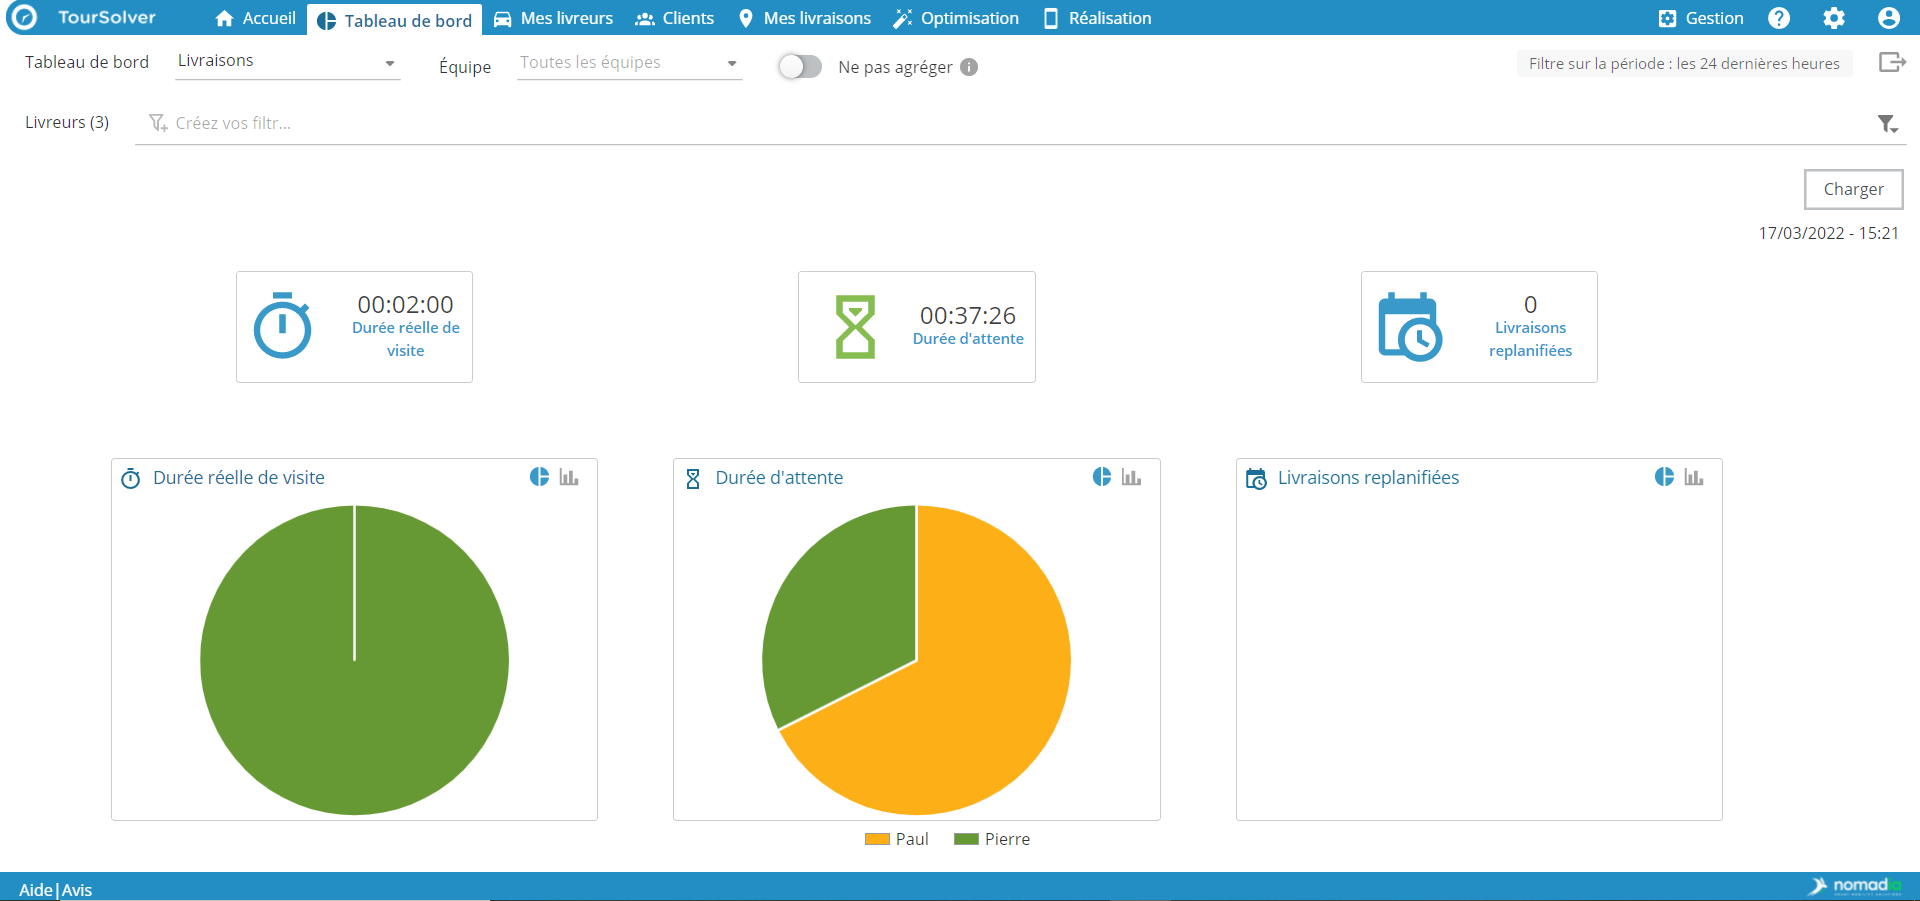
Actual visit time: tracks the actual visit time from the time the delivery person clicked "Start" in their mobile app to the time they clicked "Finish" to complete the delivery.
Waiting time: total time excluding travel time and delivery time.
Rescheduled deliveries: deliveries that could not be completed and have been rescheduled from the customer portal.
Trips
Each indicator is represented globally and then at the team/resource level according to the specified filters, over a defined period.
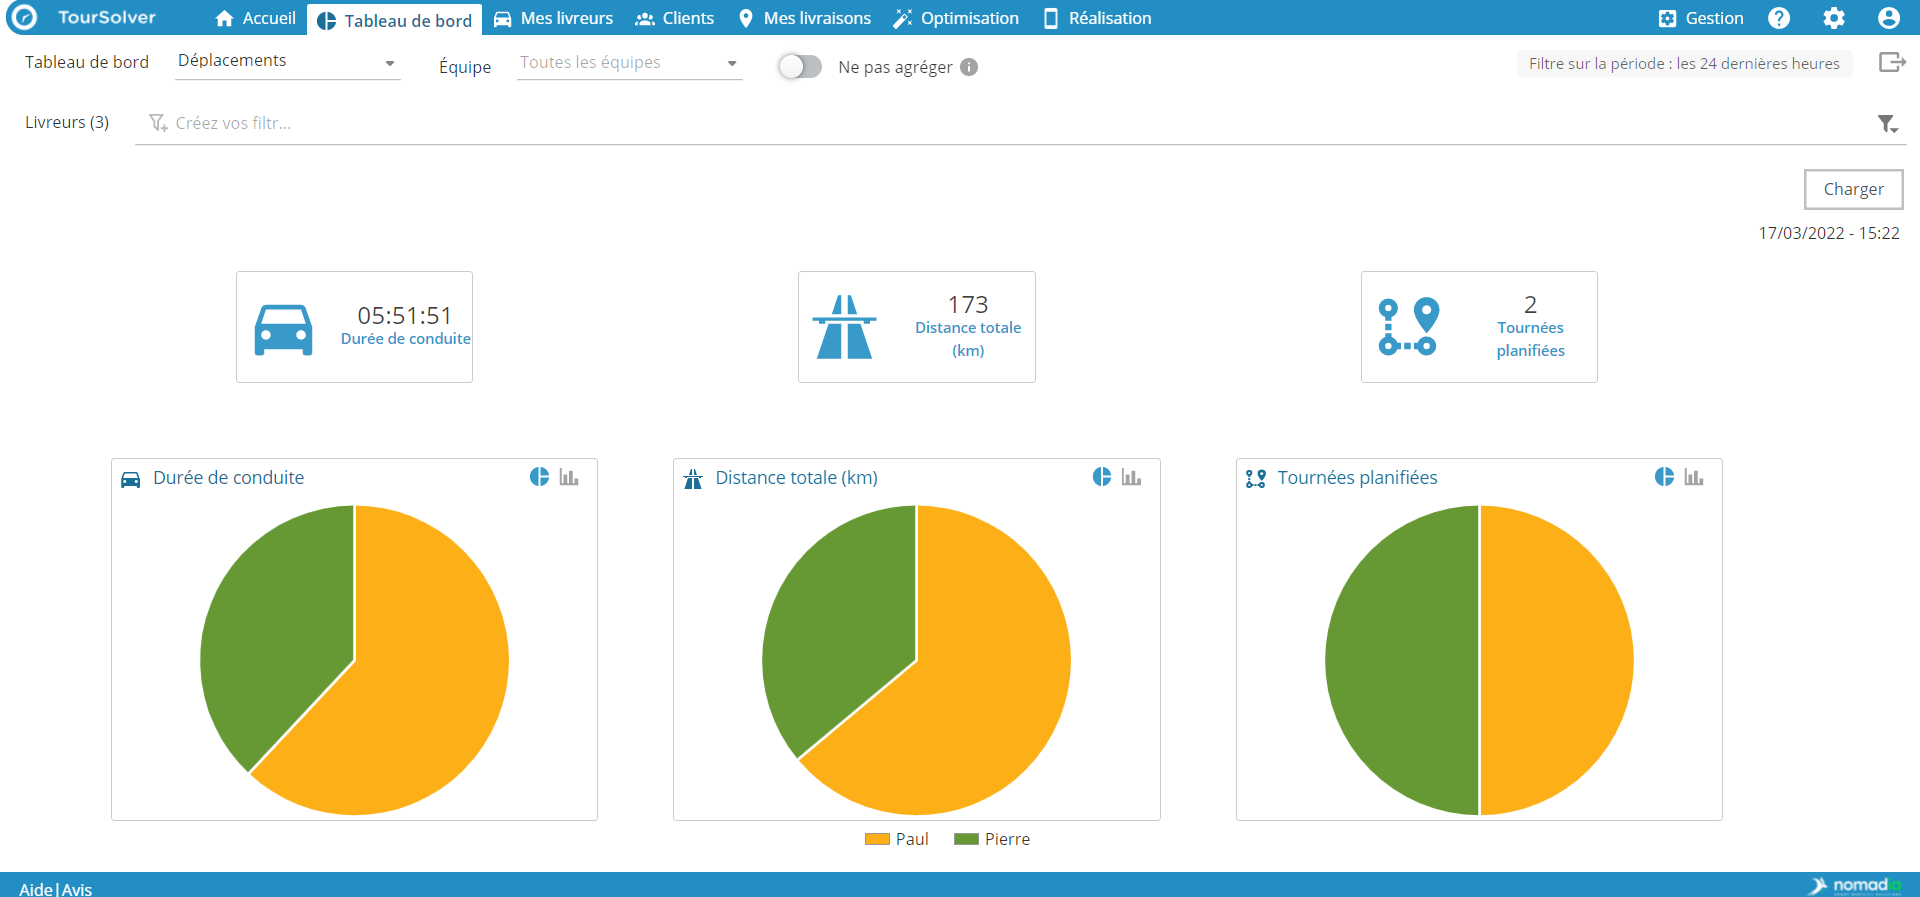
Driving time: returns the estimated driving time during optimization in HH:MM:SS.
Total distance driven: returns the estimated driving distance during the optimization in km.
Planned tours: shows the number of planned tours.
Consumption
Each indicator is represented globally and then at the team/resource level according to the specified filters, over a defined period.
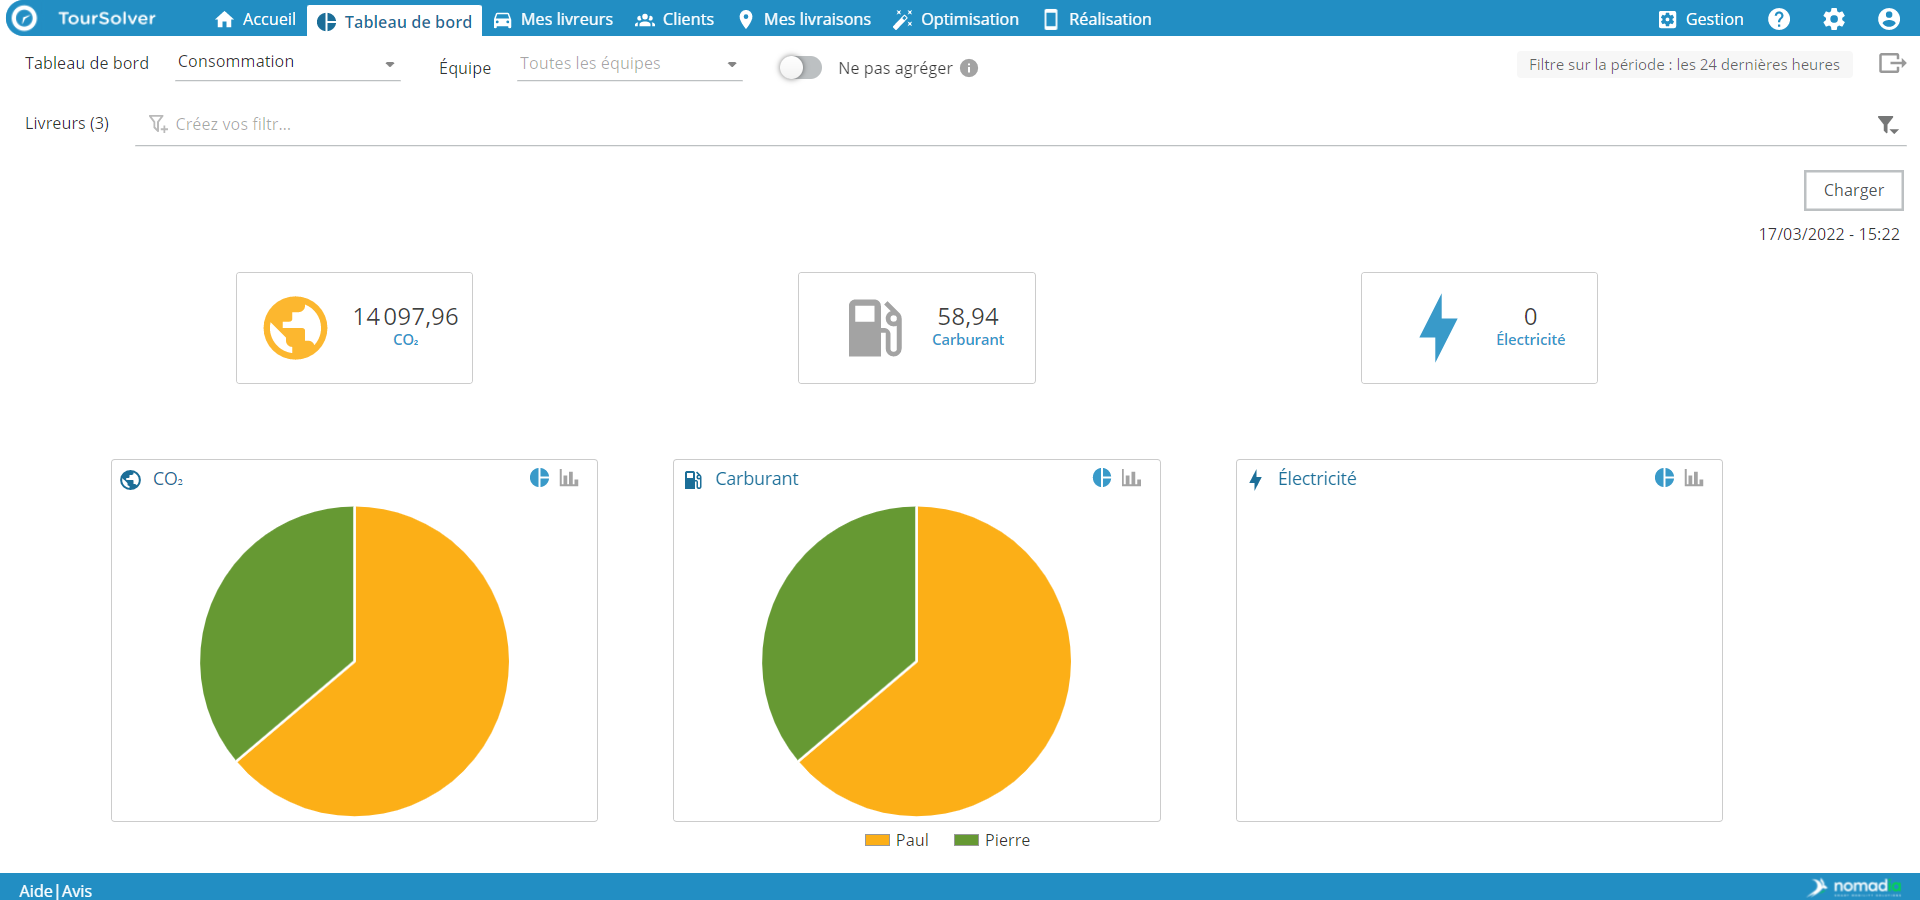
CO2: total quantity (in kg) of CO2 equivalent released into the atmosphere. This quantity is calculated from the average consumption (indicated in the vehicle profiles) and the kilometers driven.
Fuel: quantity (in L) of fuel consumed. This quantity is calculated from the average consumption (indicated in the vehicle profiles) and the kilometers driven.
Electricity: total amount (in kWh) of electricity consumed. This quantity is calculated from the average consumption (indicated in the vehicle profiles) and the kilometers driven.
Schedulers
Each indicator is represented globally and then at the team/resource level according to the specified filters, over a defined period.
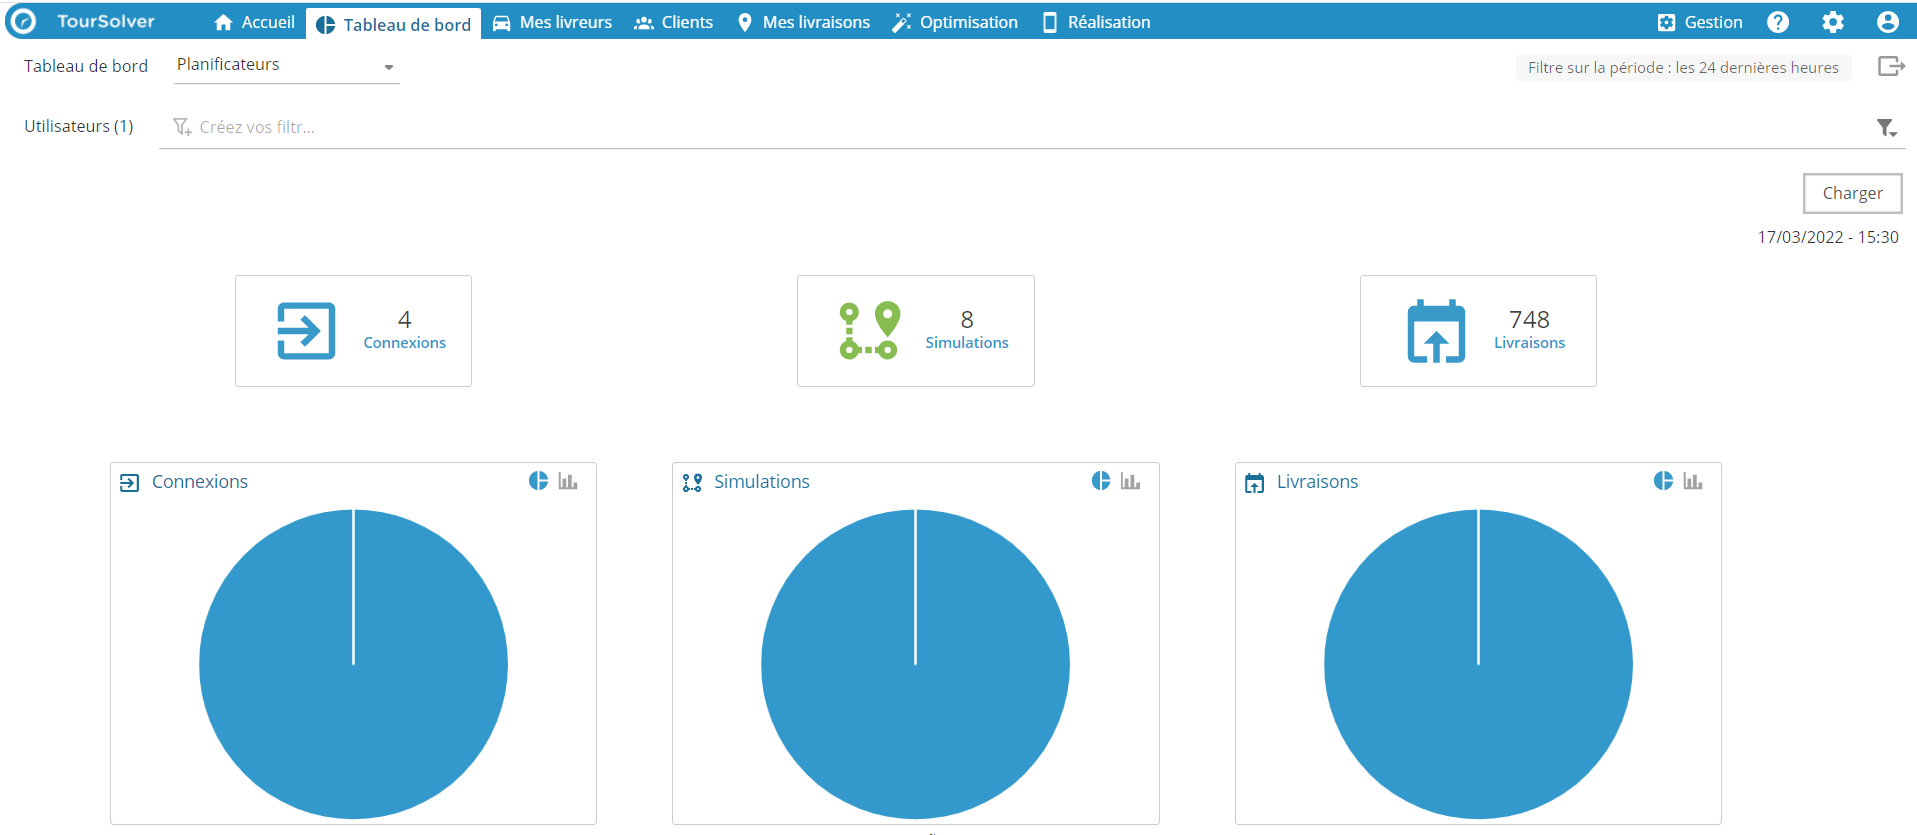
Connections: total number of connections to the TourSolver application.
Simulations: total number of simulations run (automatic and manual optimizations).
Visits: total number of imported visits.
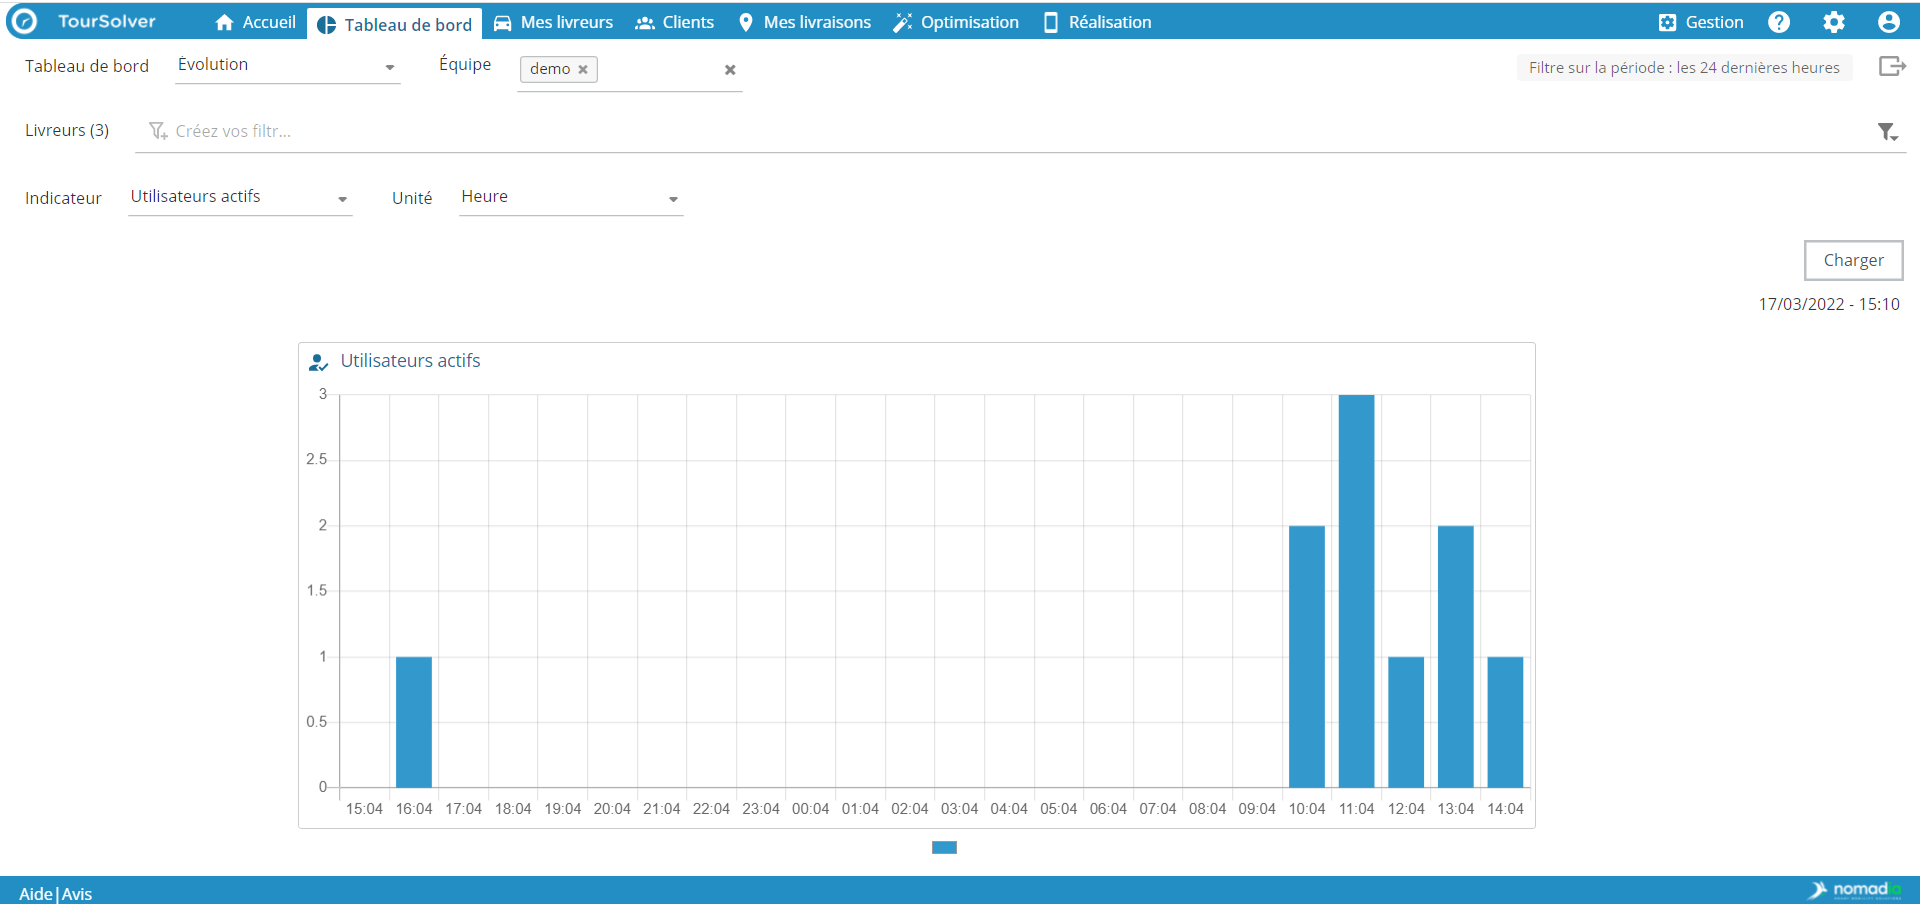
Evolution
Each indicator can be represented at the organization, team, resource or mobile user level. This dashboard gives the possibility to compare the evolution of the indicators over a selected period.
Indicators
The indicators that the user can follow are the following:
- Fulfillment: completed visits, cancelled visits, refused, late visits
- Visits: actual visit time, waiting time, rescheduled deliveries
- Trips: driving time, total distance, scheduled trips
- Administration: SMS consumed, active users, inactive users
Periodicity
The time period can be defined in hours, days or weeks. The unit is set automatically according to the filter on the period:
- the unit is in hours if the chosen period is: the last hour, the last 6 hours, the last 24 hours
- the unit is in days if the selected period is: the last 7 days, the last 14 days
- the unit is in days or weeks if the selected period is: the last month
Mobile users
Each indicator is represented globally and then at the team/mobile user level according to the specified filters, over a defined period.
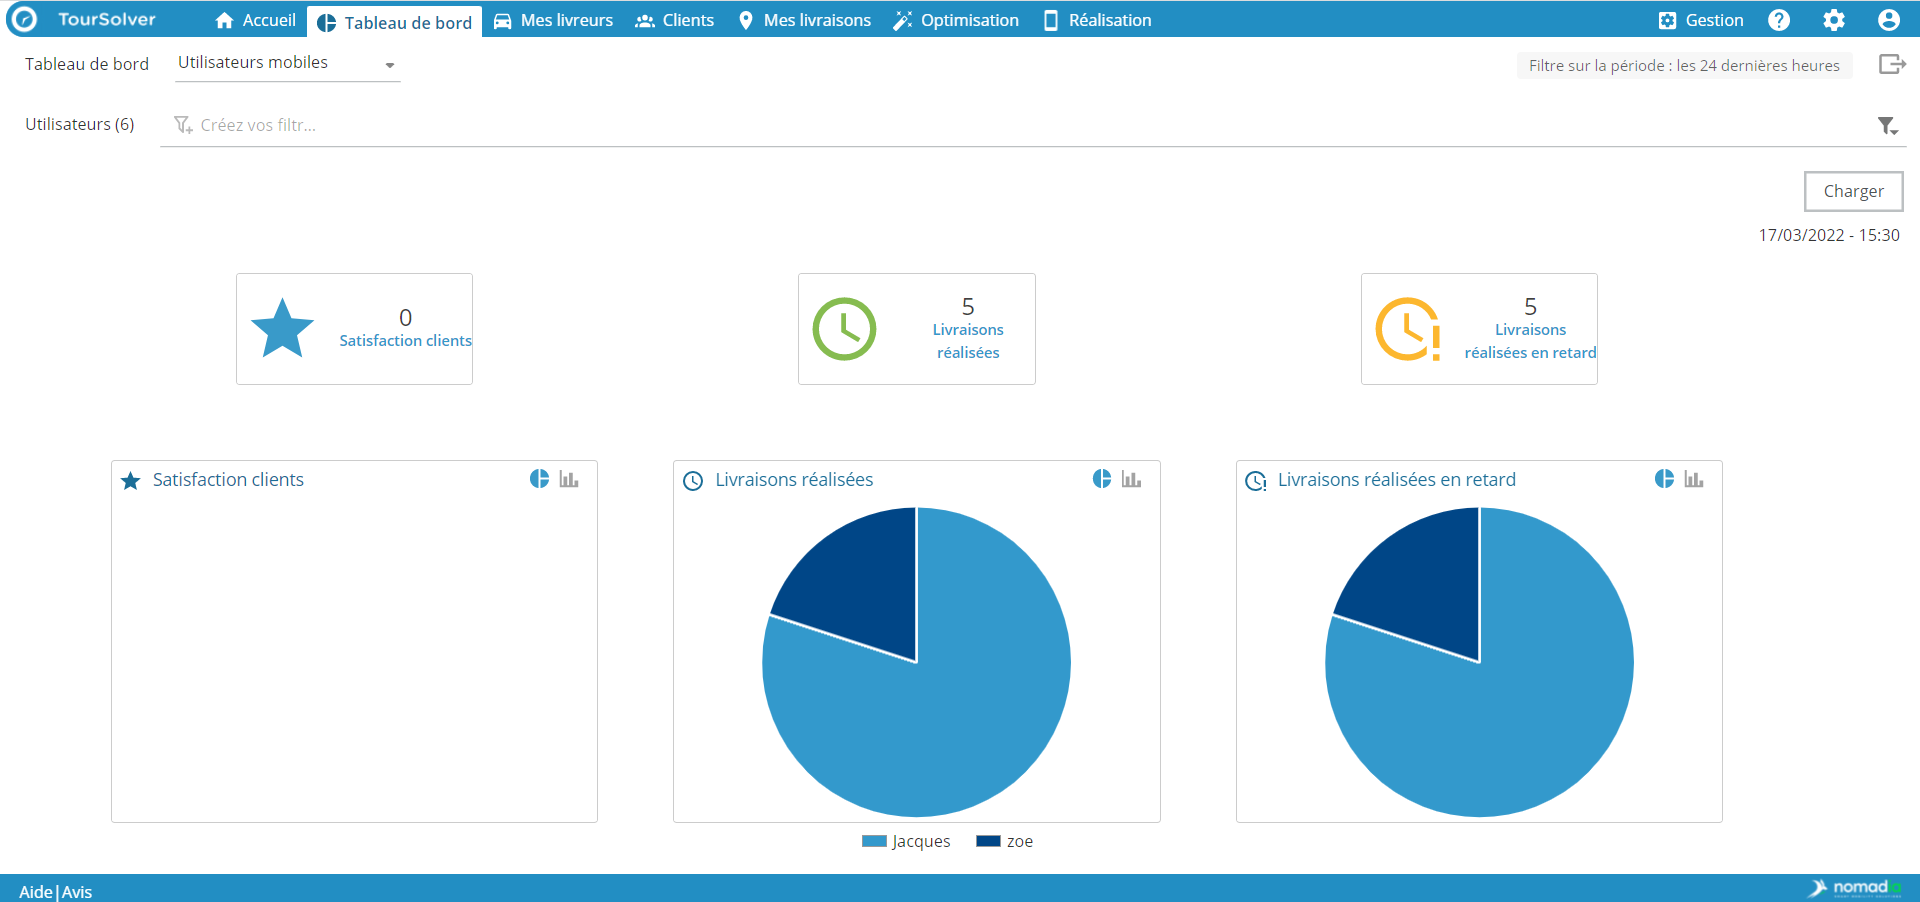
Customer satisfaction: average of the customer feedback scores defined at the end of the visit via the customer experience pages.
Deliveries made: number of completed deliveries. On-time and late deliveries are counted. Deliveries that are cancelled, abandoned or rescheduled are not counted.
Late deliveries: number of deliveries completed after the slot end time.
Happy TourSolving!