 Managing simulations
Basic principles
A simulation or route plan corresponds to a data set specific to an optimization scenario and saved localised and optimized visits. The lifespan is limited to 2 months or 1 year following validation.
See the restrictions in detail
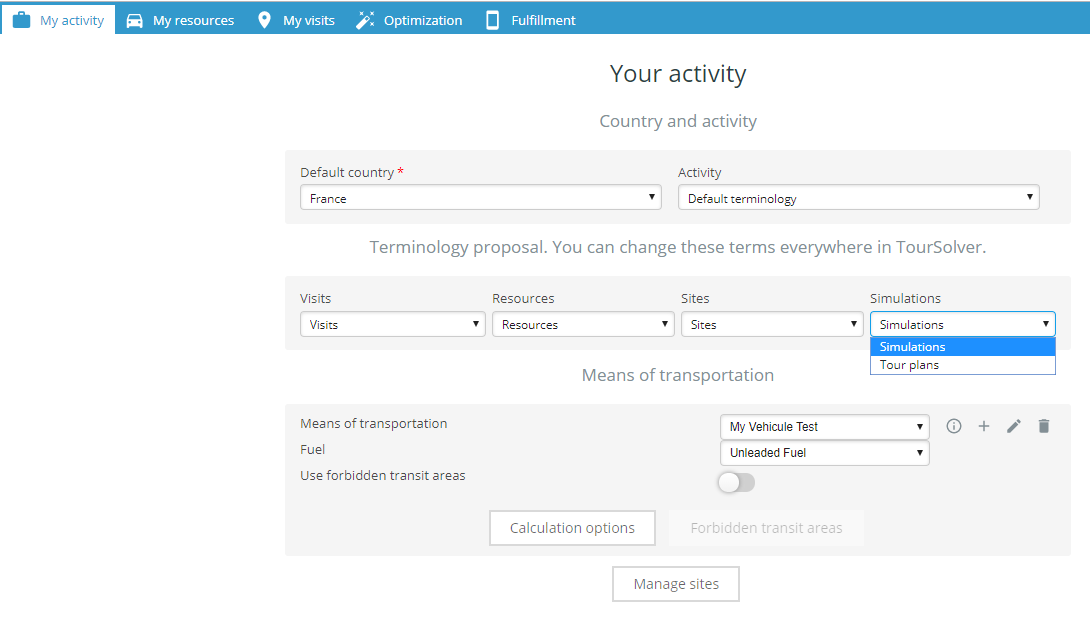
You will be able to personalise this lifespan for the «simulation» or «route plan» according to the preferences recorded via the My Activity page. For what follows of this description and to ensure readability, we will select the “simulation” lifespan.
Creation
A simulation can be created in two ways:
- Directly following the execution of a route optimization;
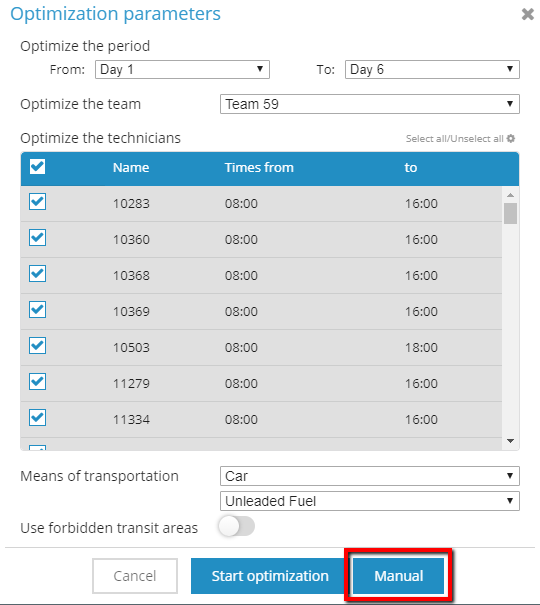
- After having clicked on the Manual button in the optimization parameters in the visits page.
By default, a simulation is date-stamped automatically on running the optimization or having first clicked on the Manual button.
Managing simulations
Consulting the list of simulations
Simulations are accessible in the form of a list via the interface in two ways:
-
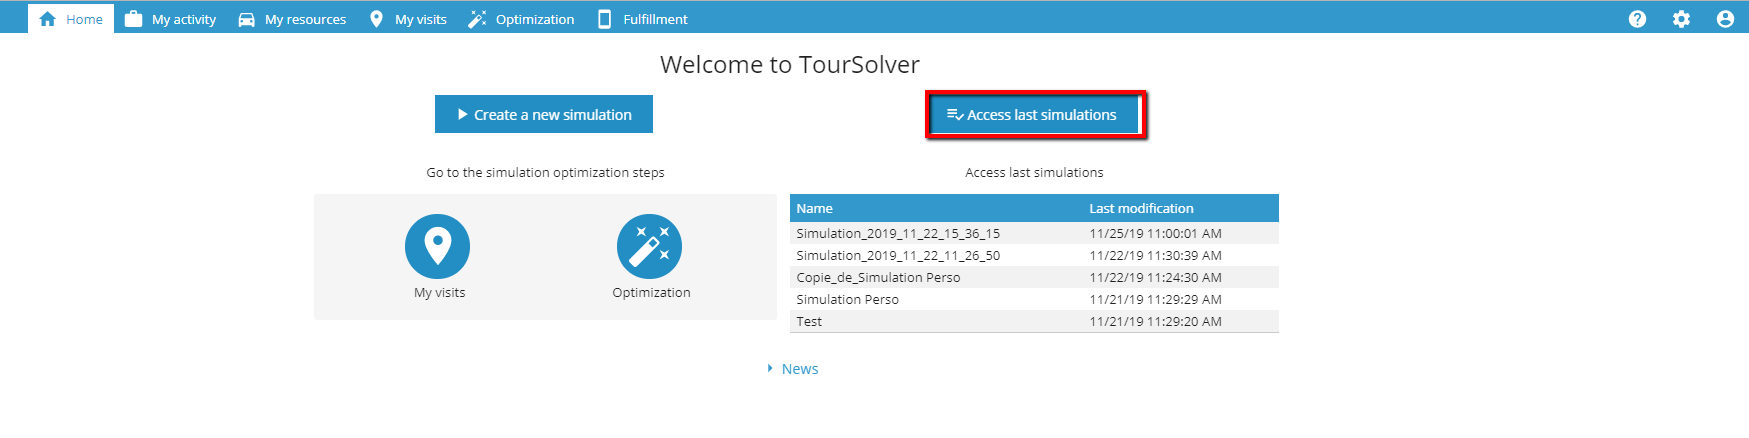
From the Home page:
- When you click on the Access last simulations button. You are then directed to the list of simulations;
- When you click directly on the list of the last 5 simulations. The target simulation opens directly without opening the simulation list.
-
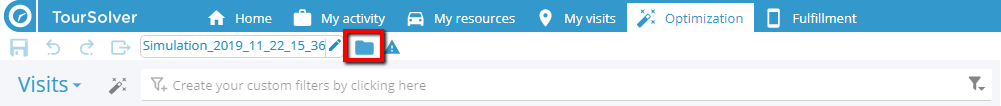
From the optimization result page, by clicking on the Folder icon that takes you to the simulations list.
For more information about the home page, refer to the Home page help from the second time you run a simulation.
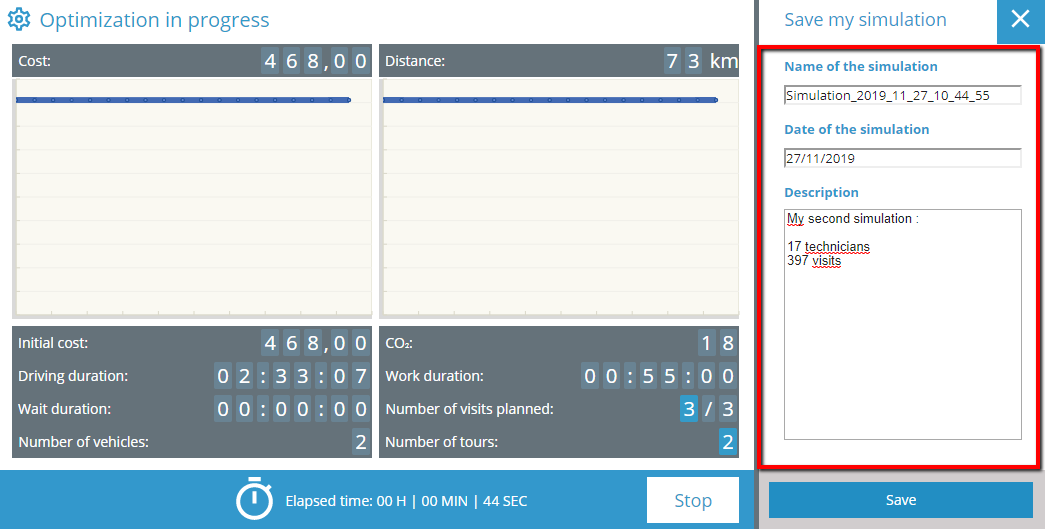
Adding metadata to a simulation
A simulation can be personalised (name, description, date) at the time an optimization is performed:
It can also be performed:
-
From the optimization result page, when you click on the edit icon;
-
From the simulation list, when you click on the edit icon of the target simulation.
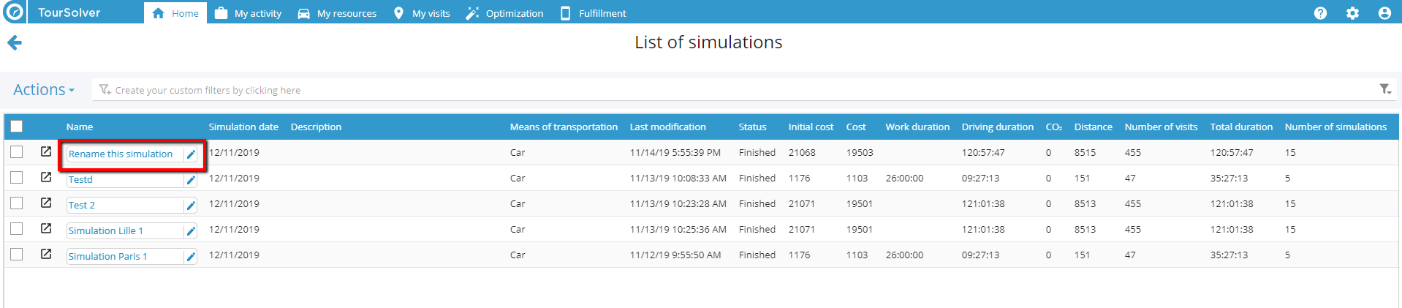
Simulations list
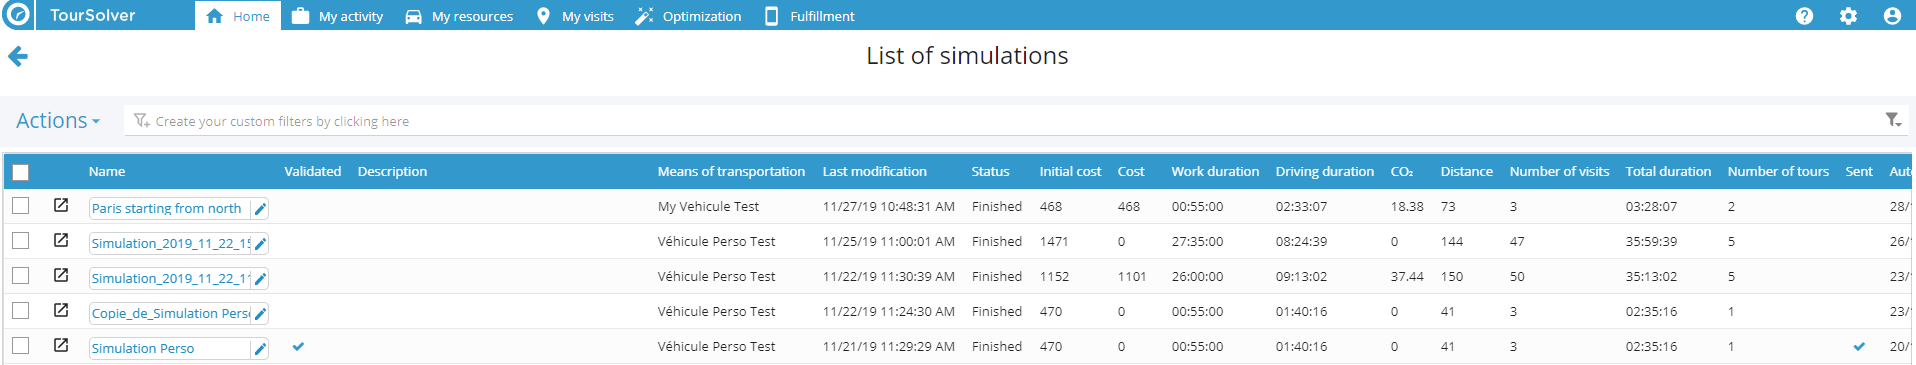
The simulations page lists all the simulations associated with your user account. It shows a table that catalogues all the simulations and their main characteristics:
- the simulation Name;
- the simulation Date (corresponding to the date saved at the time of the optimization);
- the Description that can be entered when saving the simulation at the time of optimizaton;
- Date/Time the last modification was made;
- Status of the optimization;
- Initial cost of all the routes (at the time the optimization was run);
- the Total cost of the simulation (following optimization);
- cumulative Total working hours for the whole series of visits included in this simulation;
- cumulative Drive-time duration necessary for the resources group to fulfill all visits;
- quantity of CO2 produced during the cumulative drive-times to fulfill all visits;
- the total travel Distance covered to fulfil the visits;
- Number of visits performed in this simulation;
- Total duration of this simulation;
- actual number of routes following optimization;
- the Date for Automated deletion of the simulation backup.
These indicators serve as a point of comparison when several simulations are performed over the same perimeter (resources, visits, duration...).
Possible actions
The table listing the simulations also proposes a series of possible actions that can be applied:
- Display the result page for each simulation;
- Rename each simulation;
- Compare several simulations;
- Duplicate each simulation;
- Change the Validation status of each simulation;
- Delete each simulation;
- Personnalise the information displayed in the simulations list;
- Colour certain simulations using the filters that can be applied to the various fields containing values (simulation name, date, etc).
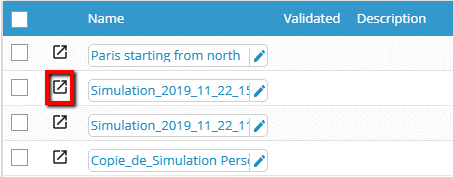
Displaying a simulation’s result page
Click on the icon located next to each simulation to access the corresponding result page.
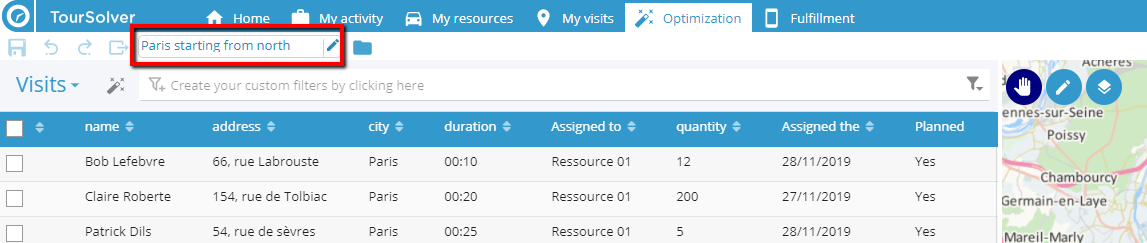
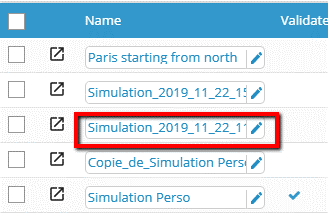
Renaming a simulation
Rename a simulation by clicking on its name to edit it. Click on the edit icon next to the name to open a fuller edit module.
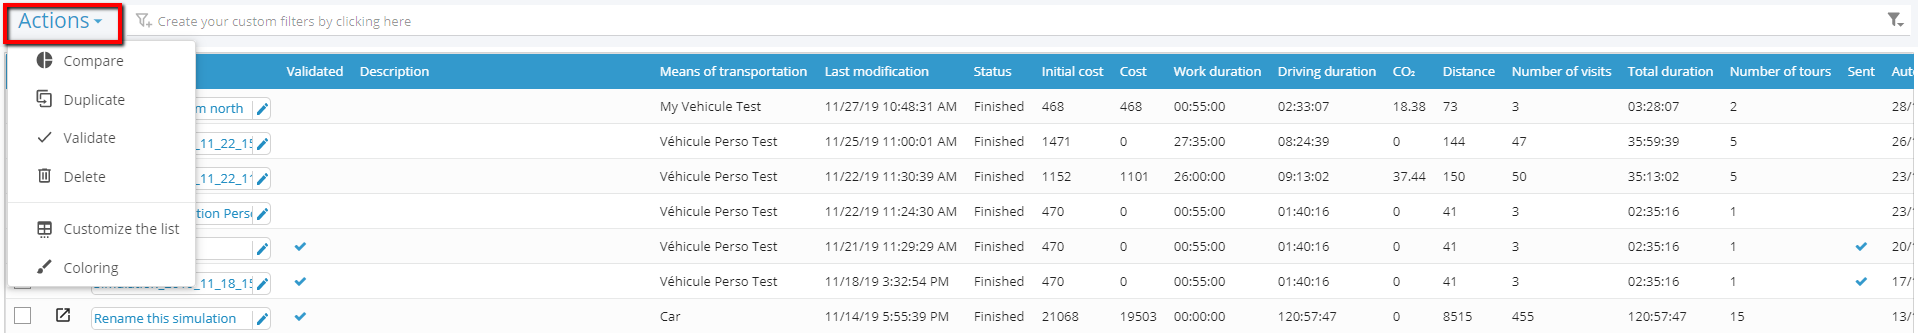
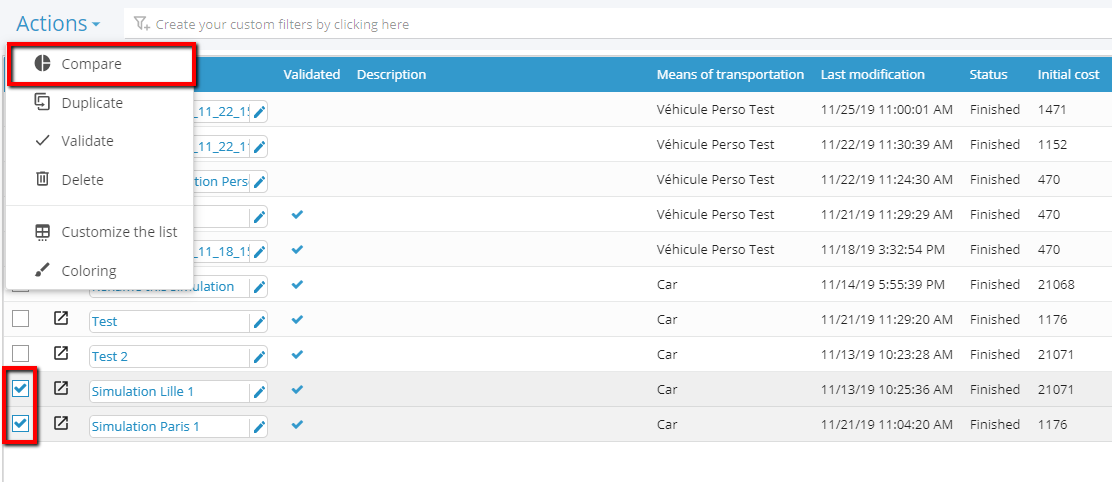
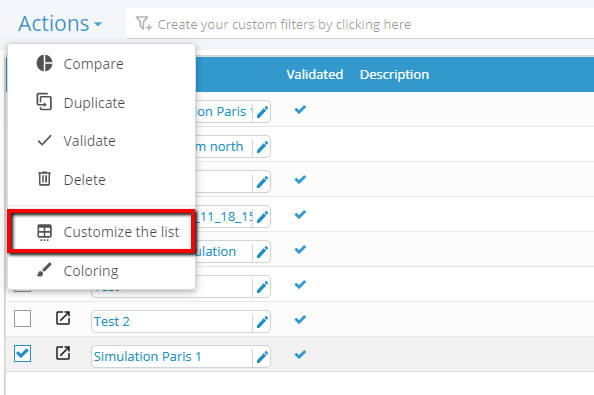
The Actions pane
The other actions are accessible via the Actions pane located above the table and applicable to all the simulations selected earlier.
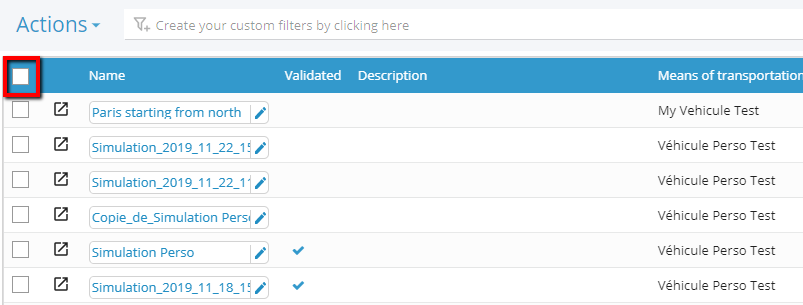
To select any of the simulations, use the check-box present at the extreme left of each line. The check-box on the table header line allows you to select all simulations simultaneously.
Comparing simulations
Once you have performed several simulations, you can compare the various results recorded by choosing one or several indicators from those displayed in the results page (drive times, distances travelled, number of visits, etc).
First, check the check-boxes of the simulations you would like to compare.
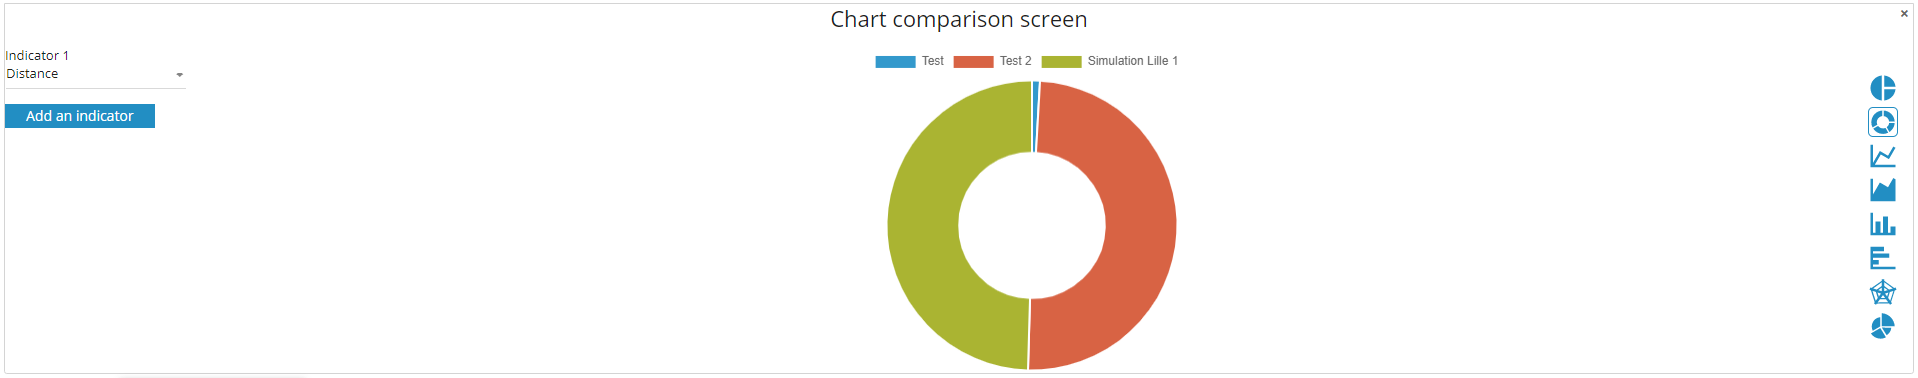
A window prompts you to select up to three comparison indicators and display the result in graph form. Different types of graphs are available.
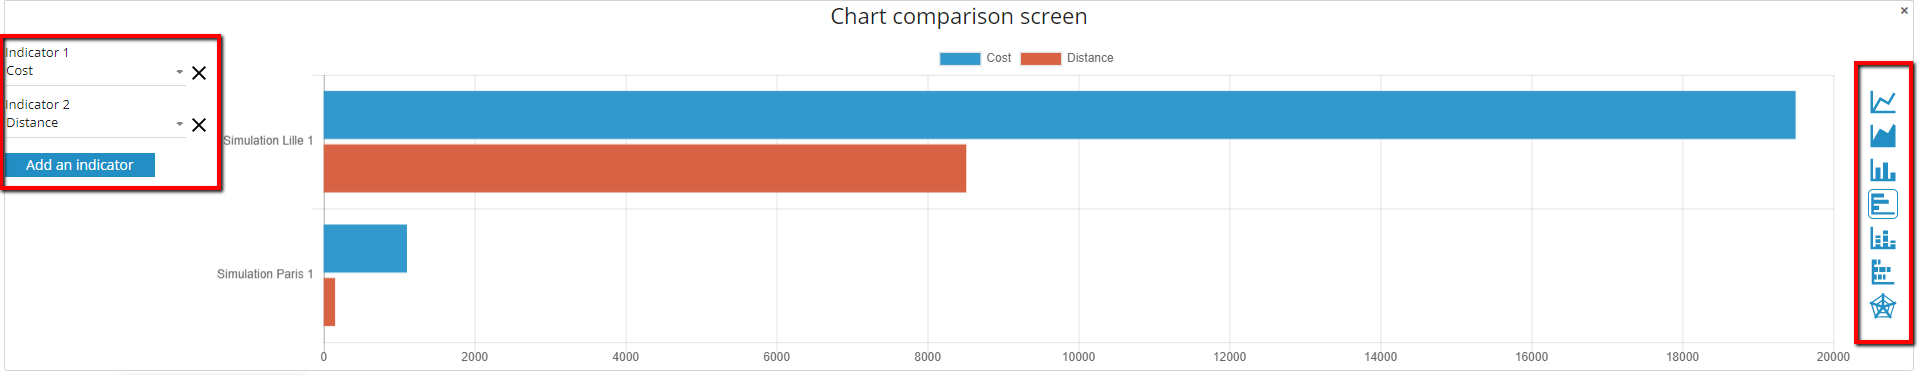
The list of graph types available will change depending on the number and type of indicators chosen for the comparison.
For example, for circle diagrams (camembert, polar or ring) will only be relevant where a comparison is made on a single criterion. This means they will not be available to use when a second criterion has been added. They are then replaced by histograms (vertical or horizontal) in a stacking arrangement.
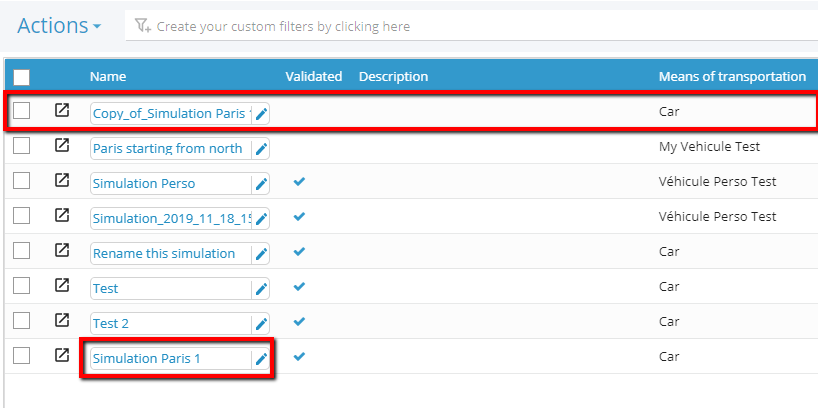
Duplicating simulations
First, select the simulations to duplicate using the corresponding checkboxes.
In the Actions pane, select Duplicate.
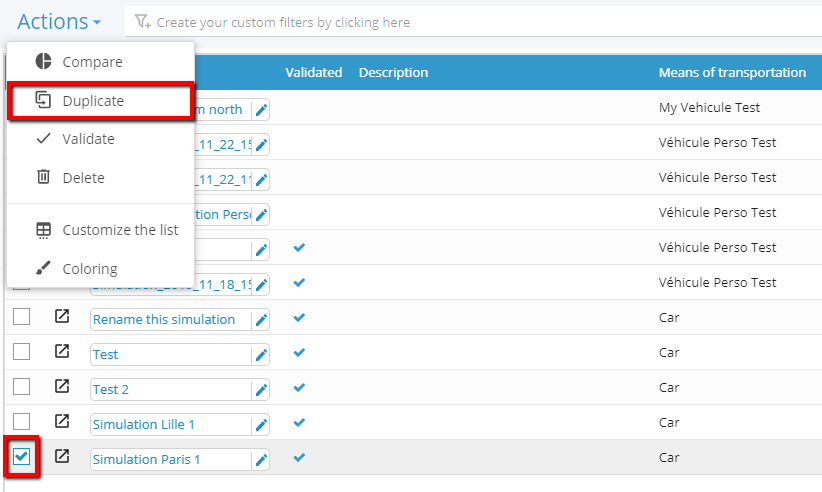
The duplicated simulations appear then in the list, with a title such as: «Copy_of_the original title»
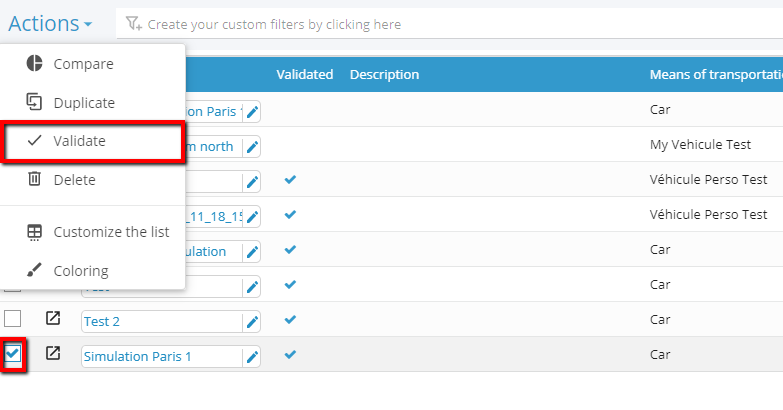
Validating simulations
First, select the simulations to validate using the corresponding check-boxes.
In the Actions pane, select Validate.
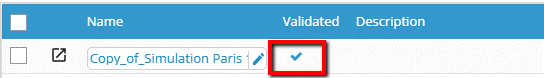
The validated simulations are marked by a sign that appears in the indicator labelled Validated in the table.
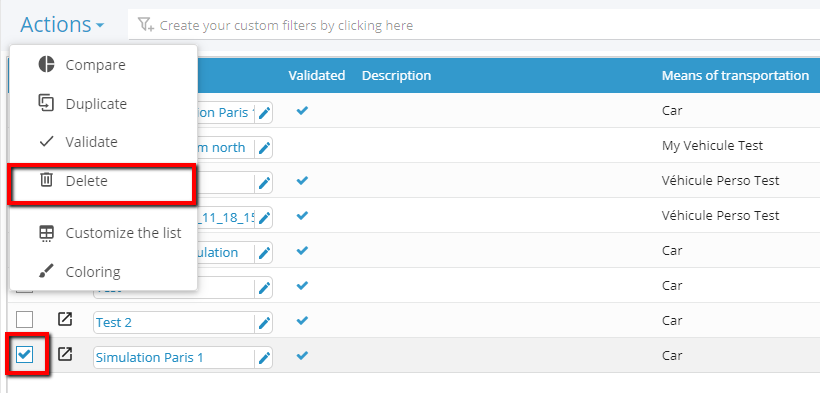
Deleting simulations
First, select the simulations to delete using the corresponding check-boxes.
In the Actions pane, select Delete.
Personalise indicators in the simulations list
In the Actions pane, select Customize the list.
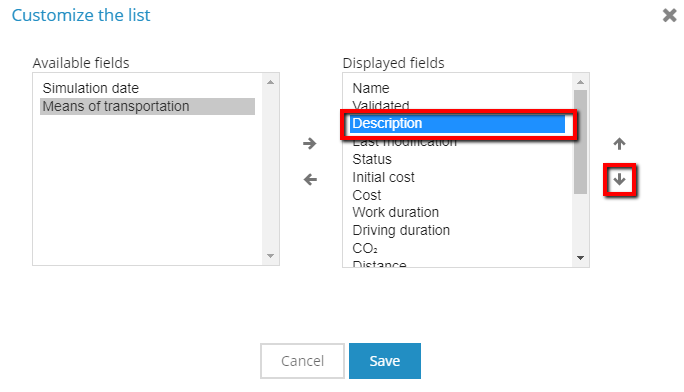
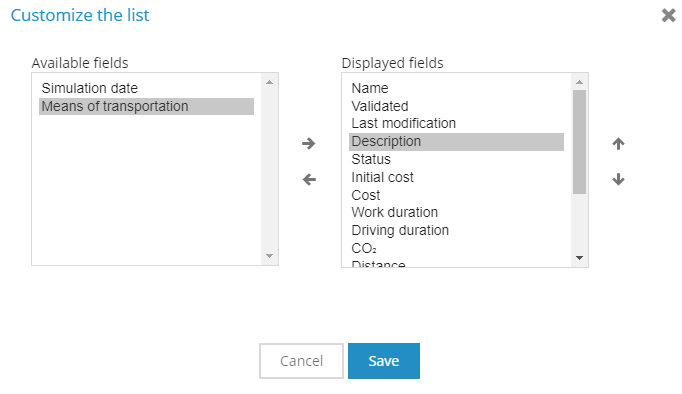
A window opens to allow you to select the indicators to display, as well as their display order in the table.
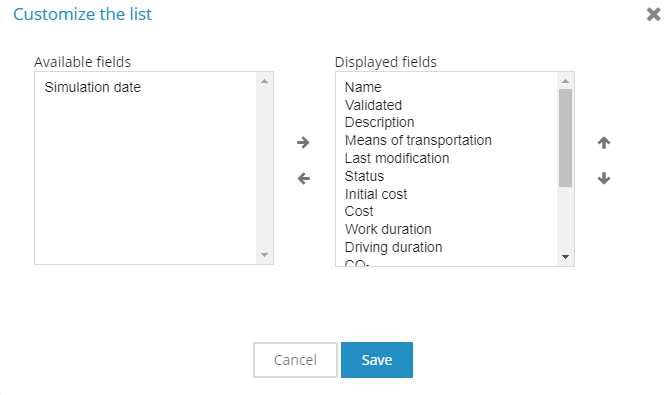
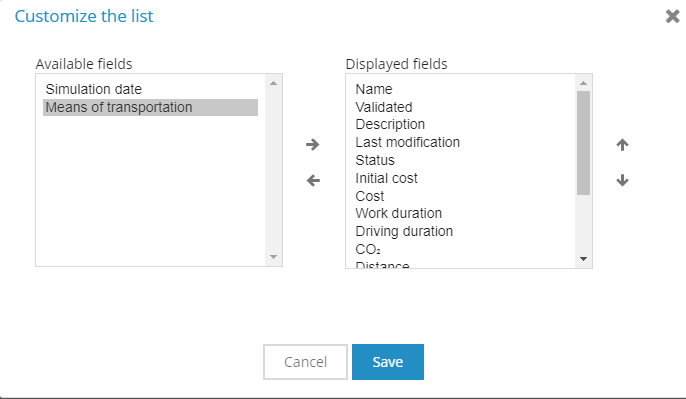
To display/hide a field, select it in the list and put it in the desired column using the left and right horizontal arrows.
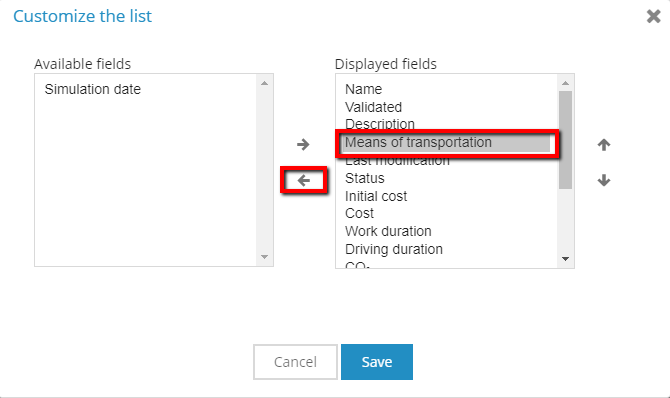
To change the order of fields in the table, select the field to move in the list of Displayed fields and replace it using the vertical up and down arrows.
Colour the simulations by applying filters to the indicators.
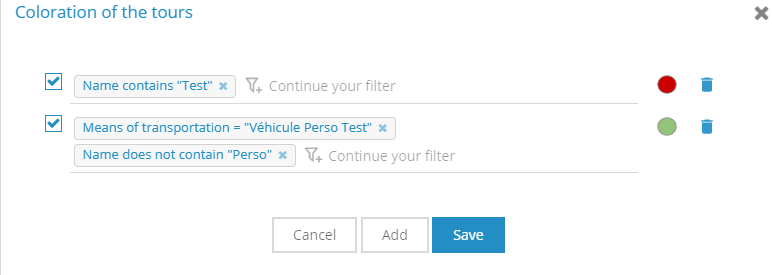
In the Actions pane, select Coloring.
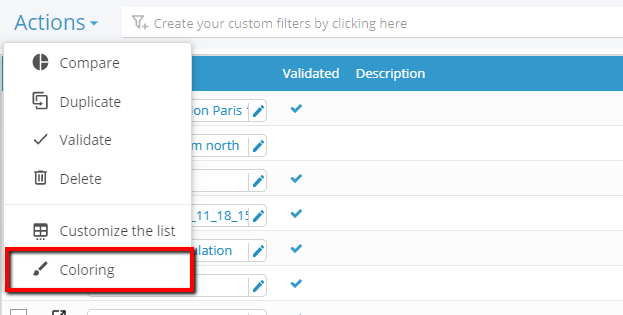
A window allows you to create coloured filters on the different indicators.
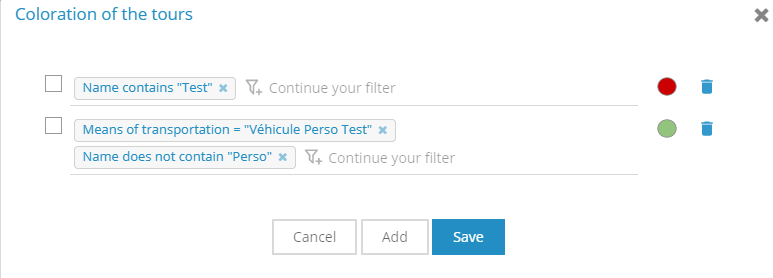
The check-box beside each filter serves to enable or disable it.
The main field provides assisted creation of filters, using the following schematic:
- An indicator (name, date, etc.)
- A condition (contains, starts with, etc)
- A free text field to fill (the name, dates sought… )
A filter line may be composed of several filters of this type using a logical function AND (the conditions must all be verified).
The colour box serves to select a filter colour.
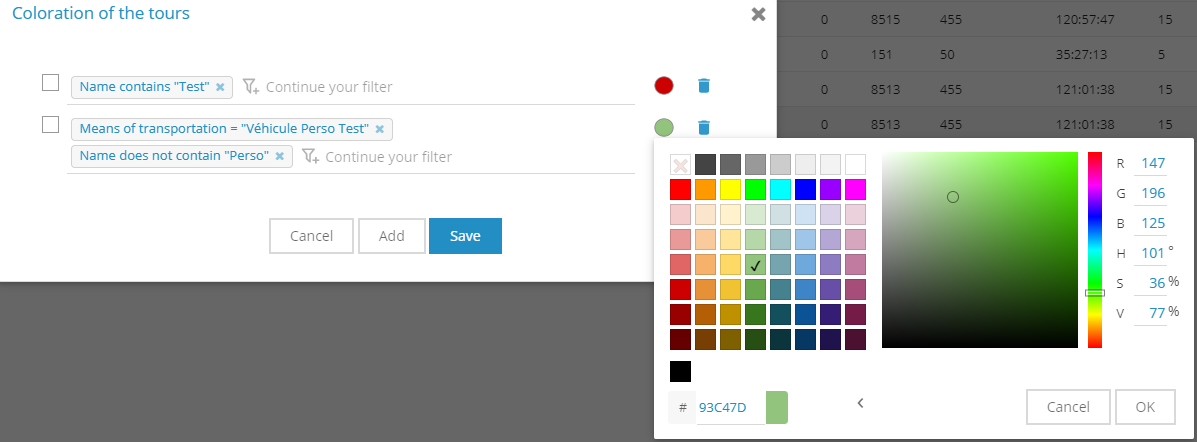
The  symbol serves to delete a filter line.
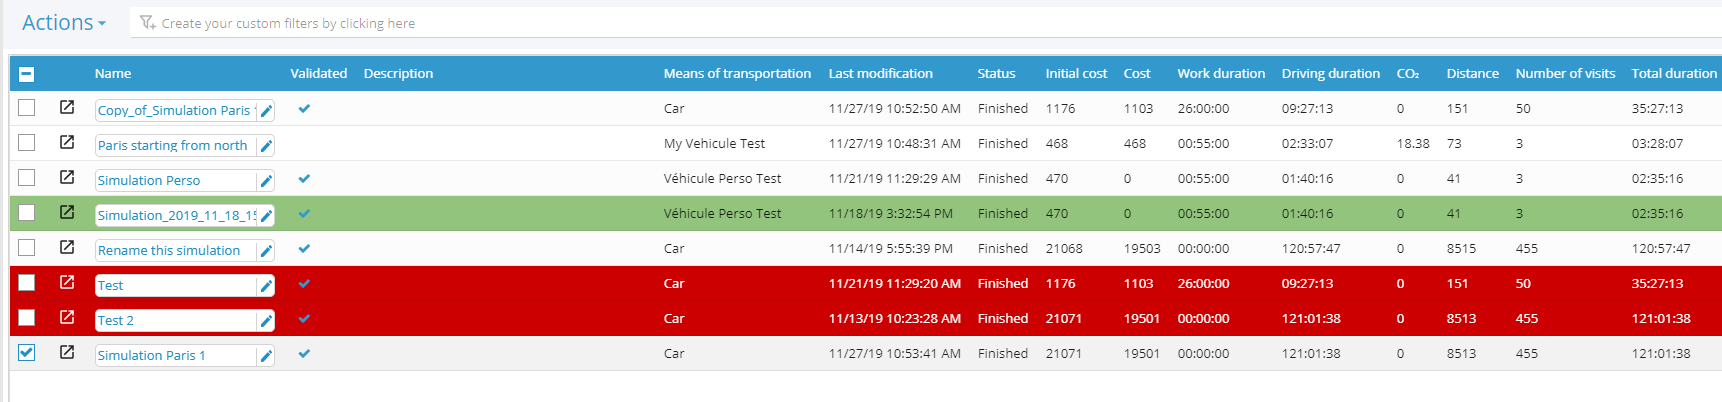
Having first clicked on Save the selected filters are applied to the simulation list.
Happy TourSolving!